Blog / Draw a dynamic SVG pattern with Vue

Draw a dynamic SVG pattern with Vue

10 min - 17 Apr 2024
TL;DR: How to create an animated SVG pattern in a Laravel Vue project. Examples are presented in GIF format at the end of the article.
You will find the source code via this Github Repository. Find out more on Capsules, X or Bluesky.
The SVG format is commonly used to display two-dimensional images or illustrations on the web. This vector format also allows for scaling up and down without loss of resolution.
But what is less common is to dynamically draw an SVG pattern via Javascript code. Although this approach offers endless possibilities, as you'll see in this article, it can also be resource-intensive.
This article illustrates the process of searching for colors to use as a background in a registration form. It starts with a Laravel template and some basic files, such as the Register page and its Layout .
resources/js/pages/Register.vue
<script setup>

import Layout from '~/components/Layout.vue';

</script>

<template>

    <Layout>

        <div class="mt-6 px-6 py-4 mx-8 sm:mx-0 bg-white overflow-hidden rounded-lg">

            <form class="space-y-4">

                ...

            </form>

        </div>

    </Layout>

</template>
resources/js/components/Layout.vue
<script setup>

import logotype from '/public/assets/capsules-logotype.svg';

</script>

<template>

    <div class="relative min-h-screen flex flex-col sm:justify-center items-center pt-6 sm:pt-0 bg-slate-100">

        <a class="relative w-16 h-16" href="/">

            <transition leave-active-class="transition ease-in duration-250" leave-from-class="opacity-100" leave-to-class="opacity-0">

                <img class="absolute w-16 h-16 select-none" v-bind:src="logotype">

            </transition>

        </a>

        <div class="w-full sm:max-w-md">

            <slot />

        </div>

    </div>

</template>
Although the visual is clear and concise, it lacks color. The dynamic SVG drawing will be performed from a dedicated component added to the Layout component. The various examples in this article will be located in the folder components/backgrounds.
resources/js/components/Layout.vue
<script setup>

import Background from '~/components/Backgrounds/Line.vue';
import logotype from '/public/assets/capsules-logotype.svg';

</script>

<template>

    <div class="relative min-h-screen flex flex-col sm:justify-center items-center pt-6 sm:pt-0">

        <a class="relative w-16 h-16" href="/">

            <transition leave-active-class="transition ease-in duration-250" leave-from-class="opacity-100" leave-to-class="opacity-0">

                <img class="absolute w-16 h-16 select-none" v-bind:src="logotype">

            </transition>

        </a>

        <div class="w-full sm:max-w-md">

            <slot />

        </div>

		<Background class="fixed -z-10 w-screen h-screen" />

    </div>

</template>
- The component has
fixed -z-10 w-screen h-screenclasses. This is done to represent the entirety of the screen background while remaining below the rest of the code.
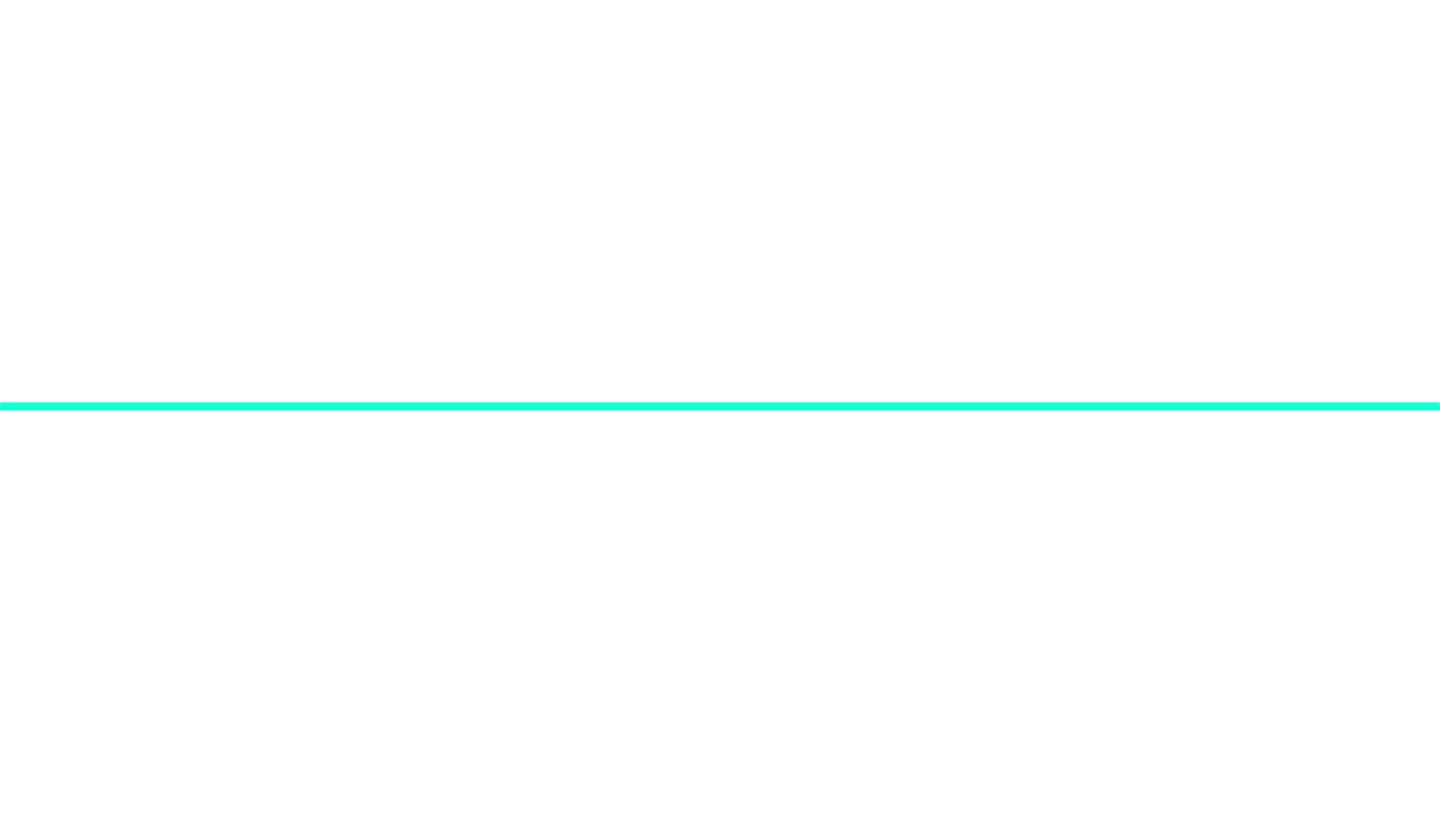
Initially, it is advisable to comment out the rest of the code that could impair visibility, and display only the Background component. This first component will aim to draw a simple line from left to right at the vertical center of the screen. This will give an idea of how to initialize a dynamic SVG.
For each step in this article, it is recommended to replace the name of the component in the import statement made in the Layout .
resources/js/components/backgrounds/Line.vue
<script setup>

import { ref, onMounted } from 'vue';

const width = 100;
const height = 100;

const path = ref();

function render()
{
    const x1 = 0;
    const y1 = height / 2;

    const x2 = width;
    const y2 = height / 2;

    path.value = `M ${x1} ${y1} ${x2} ${y2}`;
}

function color()
{
    const hue = Math.ceil( Math.random() * 360 );

    return `hsl( ${hue}, 100%, 50% )`;
}

onMounted( () => render() );

</script>

<template>

	<svg preserveAspectRatio="none" v-bind:viewBox="`0 0 ${width} ${height}`">

        <path v-bind:stroke="color()" v-bind:d="path"/>

	</svg>

</template>
preserveAspectRatio="none"allows the SVG to stretch across the entire surface.viewBoxthen represents the surface ranging from0 0 100 100, allowing for a simpler representation of the surface.
A render method is called when the component is mounted. This render method aims to draw this line following the instructions requested by the SVG . The documentation is accessible here. The method will create the path from point 0 50 to 100 50 , which is equivalent to a straight line at the center of the screen.
Another method called color is invoked to apply a random color to the stroke of the line each time the page is mounted.
Simple. Basic. To go further, one could imagine generating a given number of lines. Instead of lines, rectangles could be envisioned: a line M 0 50 100 50 would become M 0 50 100 50 100 75 0 75 Z [ M representing a movement and Z the closure of a polygon ].
resources/js/components/backgrounds/Lines.vue
<script setup>

import { ref, onMounted } from 'vue';

const width = 100;
const height = 100;

const lines = 10;
const paths = ref( [] );

function render()
{
    for( let i = 0; i < lines; i++ )
    {
        const offset = height / lines;

        let points = [];

        for( let j = 0; j <= 1; j++ )
        {
            const x = width * j;
            const y = offset * i;

            points.push( { x : x, y : y } );
        }

        const thickness = height / lines;

        for( let k = 1; k >= 0; k-- )
        {
            const x = width * k;
            const y = offset + thickness * i;

            points.push( { x : x, y : y } );
        }

        const line = points.map( point => `${point.x} ${point.y}`).join( ' ' );

        paths.value[ i ] = `M ${line} Z`;
    }
}

function color( index, length )
{
    const hue = 360 / length * index;

    return `hsl( ${hue}, 100%, 50% )`;
}

onMounted( () => render() );

</script>

<template>

	<svg preserveAspectRatio="none" v-bind:viewBox="`0 0 ${width} ${height}`">

		<path v-for=" ( path, key ) in paths " v-bind:key="`path-${key}`" v-bind:fill="color( key, paths.length )" v-bind:d="path"/>

	</svg>

</template>
- Here, the complexity lies in the dynamic construction of the different polygons in the
rendermethod. The rest is more or less straightforward: aforloop within the<path>tags that dynamically call the color as well as the dedicated path.
The render method will, based on the given line, determine its points via two loops. The first one will draw the horizontal points from left to right, while the second one will draw them from right to left with a vertical offset. This is a choice.
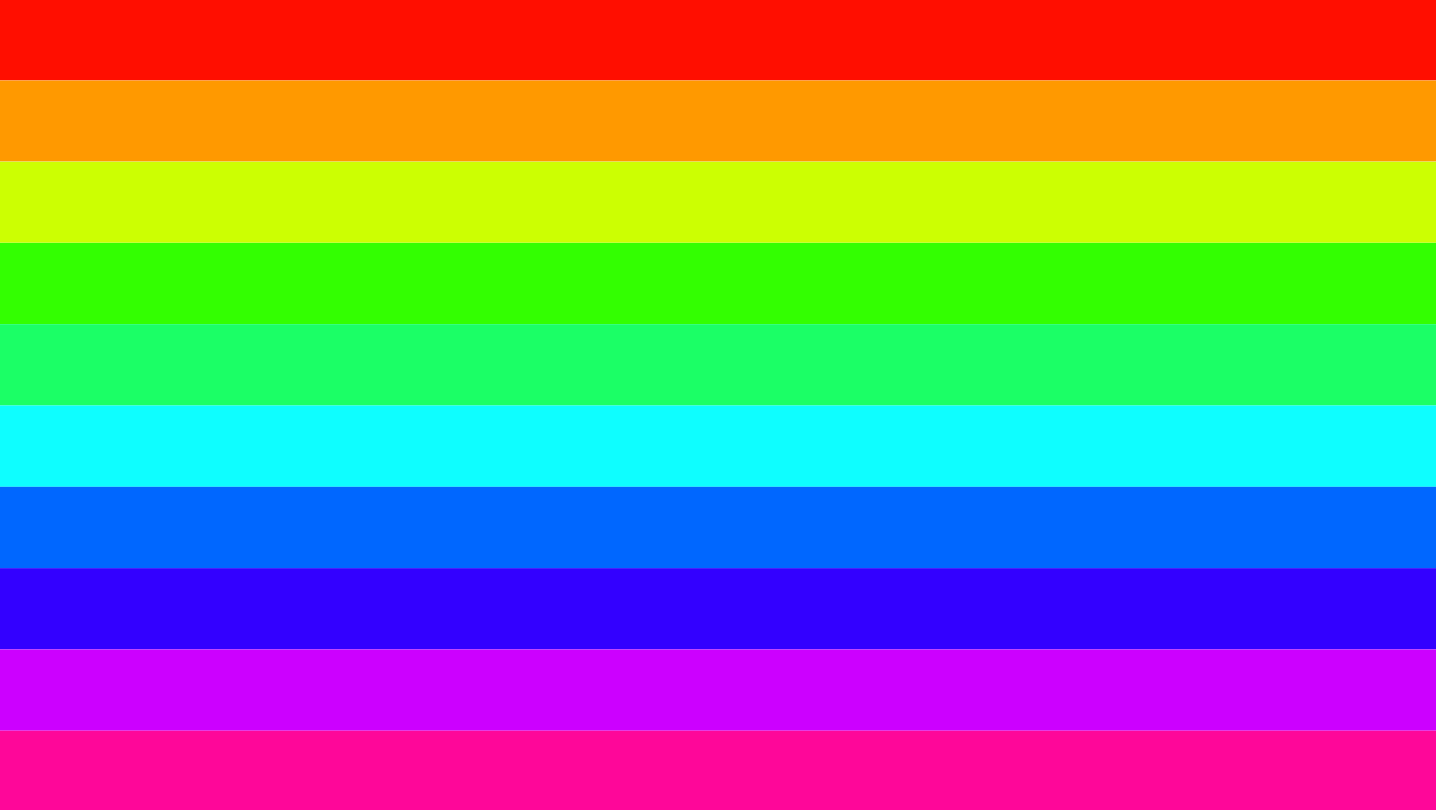
With multiple small additions and modifications, such as adjusting the number of lines, manipulating colors, and opacity, it is possible to achieve this result :
This looks like a <linearGradient>, indeed, but it is not a <linearGradient>. It's time to increase complexity : curve and time. Here is a component based on Line that displays a curve.
resources/js/components/backgrounds/Curve.vue
<script setup>

import { ref, onMounted } from 'vue';

const width = 100;
const height = 100;
const number = 20;
const amplitude = 25;

const path = ref();

function render()
{
    let points = [];

    for( let j = 0; j <= number; j++ )
    {
        const delta = j / number;
        const position = height / 2;

        const offsetX = width / number;
        const offsetY = Math.cos( Math.PI * delta );

        const x = offsetX * j;
        const y = offsetY * amplitude + position;

        points.push( { x : x, y : y } );
    }

    const curve = points.map( point => `${point.x} ${point.y}`).join( ' ' );

    path.value = `M ${curve}`;
}

function color()
{
    const hue = Math.ceil( Math.random() * 360 );

    return `hsl( ${hue}, 100%, 50% )`;
}

onMounted( () => render() );

</script>

<template>

	<svg preserveAspectRatio="none" v-bind:viewBox="`0 0 ${width} ${height}`">

        <path fill="none" v-bind:stroke="color()" v-bind:d="path"/>

	</svg>

</template>
- This component has two new variables:
numberandamplitude: numberrepresents the number of points that this curve has.amplituderepresents the height of the curve.
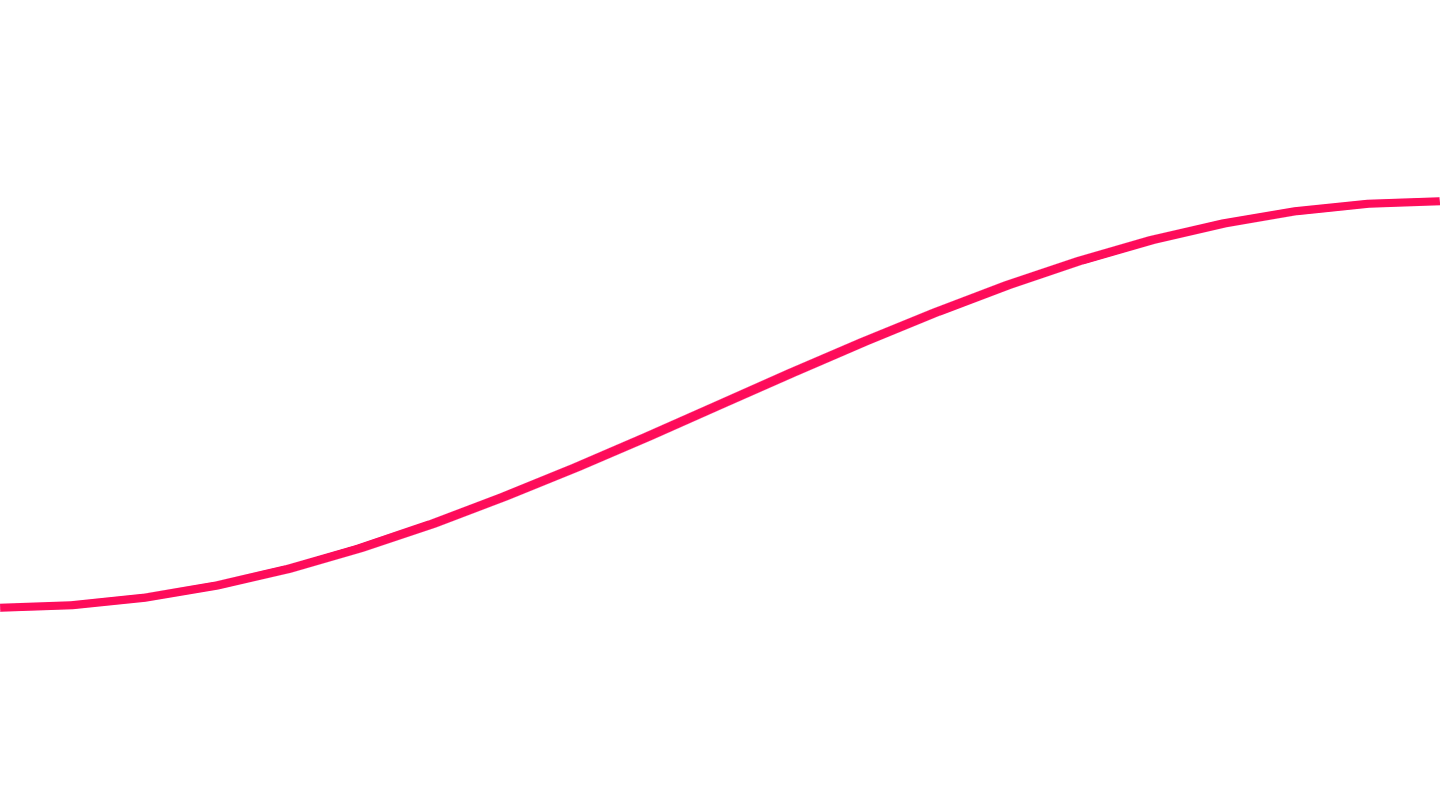
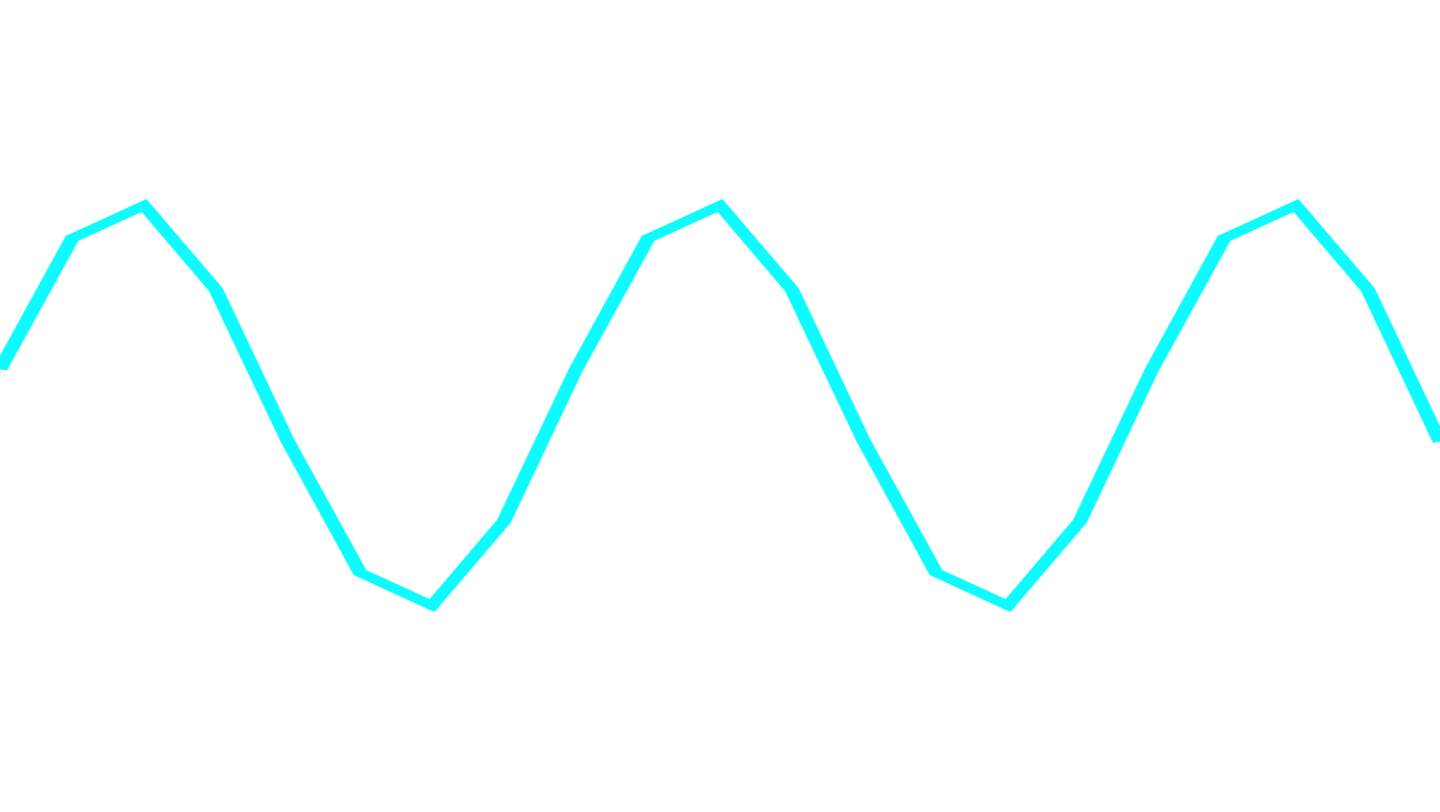
The particularity of the render function lies in the variable delta and the use of Math.cos(). offsetY then returns a value between -1 and 1 depending on the position of the curve coupled with PI. We multiply this value by the amplitude as well as its vertical position to obtain this curve :
A multiplier can be added to delta to increase or decrease the number of oscillations.
An oscillation being a journey between two successive passages, the current one is therefore a half-oscillation. Math.cos(2 * Math.PI * delta) then represents the equivalent of a full oscillation, and the oscillation multiplier represents its number.
const oscillation = 2.5;

const delta = oscillation * j / number;

const offsetY = Math.cos( 2 * Math.PI * delta );
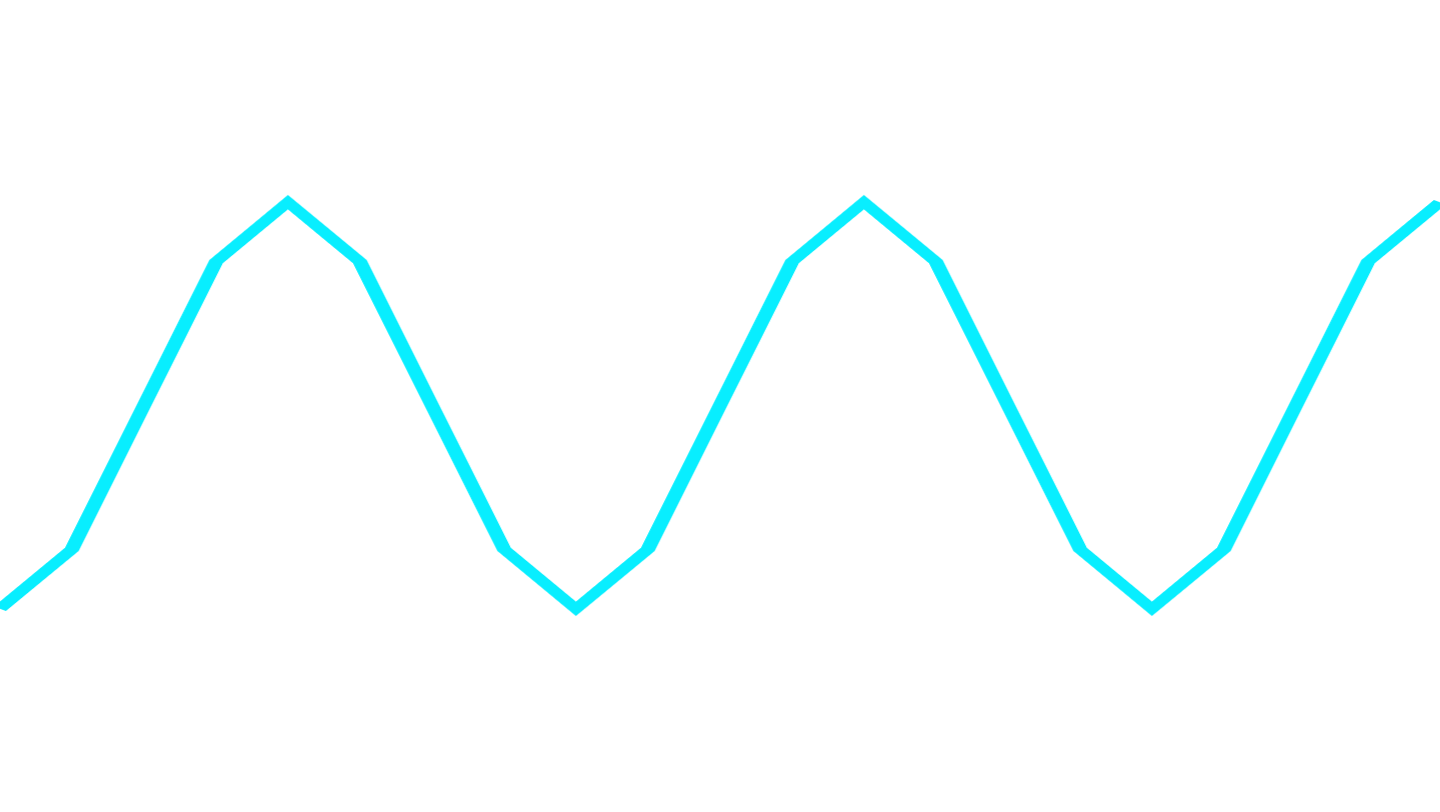
- Now there are more than two oscillations, but since the number of points has not been modified, the smoothing of the curves is lacking. To address this, for example, you can change the number of points from
20to100.
Now it's time to apply the concept of time to animate this curve. Two new variables and a global function come into play: rate, duration, and setInterval().
import { onMounted, onUnmounted } from 'vue';

let rendering;

const rate = 15;

onMounted( () => rendering = setInterval( () => render(), rate ) );

onUnmounted( () => clearInterval( rendering ) );
These variables and methods will allow calling the render function 67 times per second. All that's left is to calculate the delta , integrating time and duration with the current oscillation and i and number.
<script setup>

import { ref, onMounted, onUnmounted } from 'vue';

let rendering;

const width = 100;
const height = 100;

const rate = 15;
const duration = 4000;

const number = 20;
const amplitude = 25;
const oscillation = 2.5;

const path = ref();
const color = ref();

function render()
{
    const time = new Date().getTime();

    let points = [];

    for( let i = 0; i <= number; i++ )
    {
        const delta = 2 * ( ( time + i * oscillation * ( duration / number ) ) % duration ) / duration;
        const position = height / 2;

        const offsetX = width / number;
        const offsetY = Math.cos( Math.PI * delta );

        const x = offsetX * i;
        const y = offsetY * amplitude + position;

        points.push( { x : x, y : y } );
    }

    const curve = points.map( point => `${point.x} ${point.y}`).join( ' ' );

    path.value = `M ${curve}`;

    color.value = `hsl( ${time / rate % 360}, 100%, 50% )`;
}

onMounted( () => rendering = setInterval( () => render(), rate ) );

onUnmounted( () => clearInterval( rendering ) );

</script>

<template>

	<svg preserveAspectRatio="none" v-bind:viewBox="`0 0 ${width} ${height}`">

        <path fill="none" v-bind:stroke="color" v-bind:d="path"/>

	</svg>

</template>
Now, imagination is the only limit :
resources/js/components/backgrounds/Waves.vue
<script setup>

import { ref, onMounted, onUnmounted } from 'vue';

let interval;

const width = 100;
const height = 100;

const rate = 15;

const number = 50;
const waves = [
    { position : 60, amplitude : 2, delay : 6000, duration : 32000, color : '#33E5E1' },
    { position : 68, amplitude : 4, delay : 4000, duration : 22000, color : '#007991' },
    { position : 76, amplitude : 6, delay : 2000, duration : 12000, color : '#222E50' },
];
const paths = ref( [] );

function render()
{
    const time = new Date().getTime();

    for( let i = 0; i < waves.length; i++ )
    {
        let points = [];

        for( let j = 0; j <= number; j++ )
        {
            const delta = 2 * ( time + waves[ i ].delay + j * ( waves[ i ].duration / number ) % waves[ i ].duration ) / waves[ i ].duration;
            const offsetX = width / number;
            const offsetY = Math.cos( Math.PI * delta );

            const x = offsetX * j;
            const y = offsetY * waves[ i ].amplitude + waves[ i ].position;

            points.push( { x : x, y : y } );
        }

        const curve = points.map( point => `${point.x} ${point.y}`).join( ' ' );

        paths.value[ i ] = `M ${curve} 100 100 0 100 Z`;

    }
}

onMounted( () => interval = setInterval( () => render() , rate ) );

onUnmounted( () => clearInterval( interval ) );

</script>

<template>

	<svg preserveAspectRatio="none" v-bind:viewBox="`0 0 ${width} ${height}`">

        <path fill="#F5F5F5" d="M 0 0 100 0 100 100 0 100 Z" />

        <linearGradient v-for=" ( wave, key ) in waves " v-bind:id="`wave-gradient-${key}`" v-bind:key="`wave-gradient-${key}`" x1="0" x2="0" y1="0" y2="1">

            <stop offset="0%" v-bind:stop-color="wave.color" />

            <stop offset="100%" v-bind:stop-color="waves[ key + 1 ] ? waves[ key + 1 ].color : '#12192b' " />

        </linearGradient>

        <path v-for=" ( path, key ) in paths " v-bind:key="`path-${key}`" v-bind:fill="`url(#wave-gradient-${key})`" v-bind:d="path"/>

	</svg>

</template>
Another example :
resources/js/components/backgrounds/Pixels.vue
<script setup>

import { ref, onMounted, onUnmounted } from 'vue';

let interval;

const width = 100;
const height = 60;

const rate = 40;

const colors = ref( [] );
const paths = ref( [] );

function setPaths()
{
    for( let i = 0; i < width * height; i++ )
    {
        const x = i % width;
        const y = Math.floor( i / width );

        paths.value[ i ] = `M ${x} ${y} H ${x+1} V ${y+1} H ${x} Z`;
    }
}

function setColors()
{
    for( let i = 0; i < width * height; i++ )
    {
        colors.value[ i ] = `#${Math.floor( Math.random() * 16777215 ).toString( 16 )}`;
    }
}

onMounted( () =>
{
    setColors();

    setPaths();

    interval = setInterval( () => setColors() , rate );
} );

onUnmounted(() => clearInterval( interval ) );

</script>

<template>

	<svg preserveAspectRatio="none" v-bind:viewBox="`0 0 ${width} ${height}`">

        <path v-for=" index in width * height " v-bind:key="`path-${index - 1}`" v-bind:fill="colors[ index - 1 ]" v-bind:d="paths[ index - 1 ]"/>

	</svg>

</template>
- The
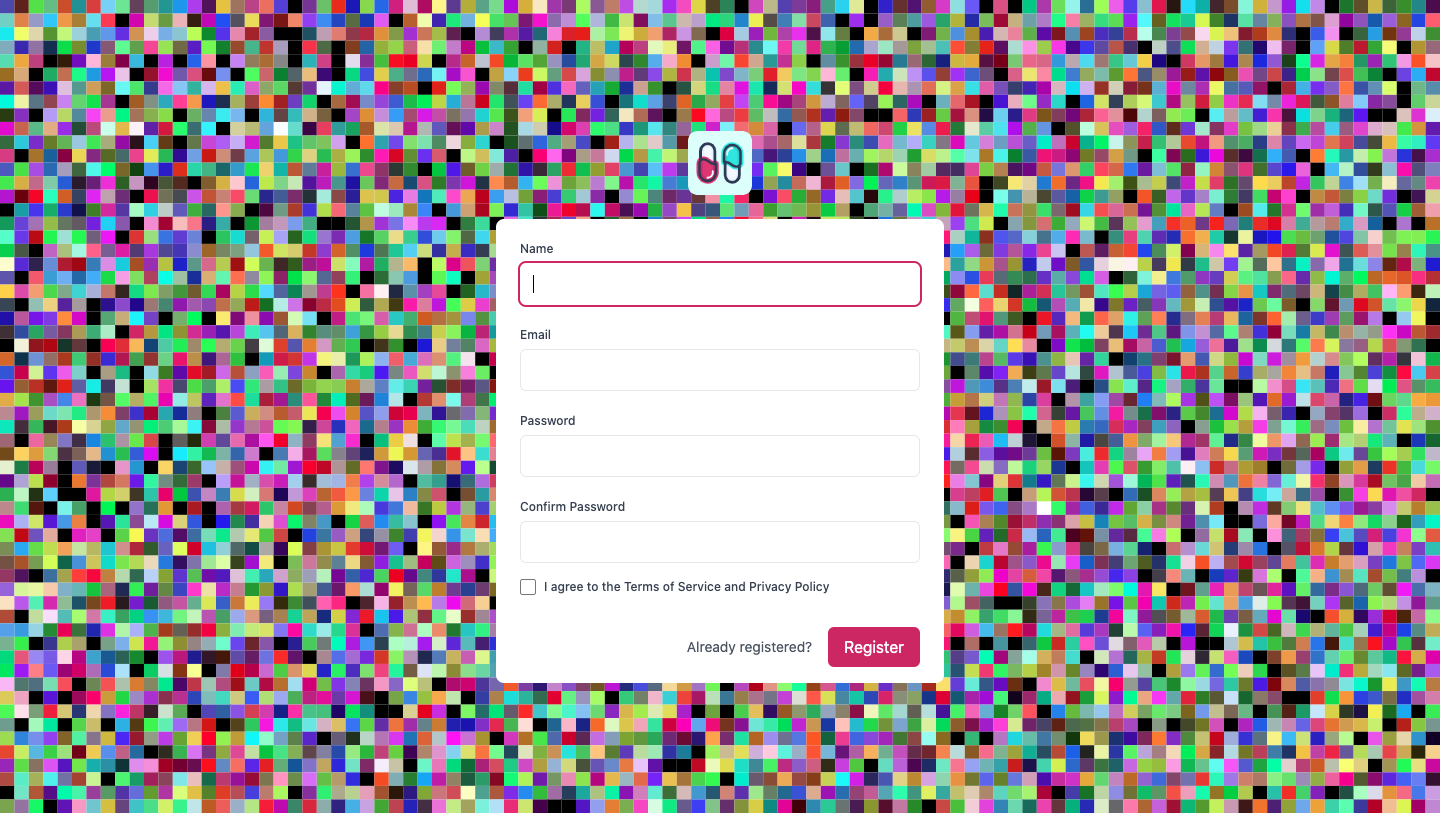
rateof40is a choice in this case. The current values ask the browser to call the methodMath.floor( Math.random() * 16777215 ).toString( 16 )40 * 100 * 60 times. This represents 240,000 calculations per second for the result below. Quite a resource-intensive process.
Watch out for your eyes.
By highlighting the use of the various suggested concepts in this article, the visual can achieve this result :
resources/js/components/backgrounds/Pattern.vue
<script setup>

import { ref, onMounted, onUnmounted } from 'vue';

let interval;

const width = 120;
const height = 120;

const rate = 10;
const duration = 20000;

const curves = 20;
const number = 100;
const oscillation = 3;
const amplitude = 5;
const thickness = 1;
const delay = 1000;

const colors = [ "#ab81f2", "#ff7ab4", "#ff9b8b" ];
const paths = ref( [] );

function generate()
{
    let time = new Date().getTime();

    for( let i = 0; i < curves; i++ )
    {
        time = time + delay;

        let points = [];

        for( let j = 0; j <= number; j++ )
        {
            const offsetX = width / number;
            const x = offsetX * j;

            const delta = 2 * ( ( time + j * oscillation * ( duration / number ) ) % duration ) / duration;
            const offsetY = Math.cos( Math.PI * delta );
            const y = offsetY * amplitude + ( height / curves * i );

            points.push( { x : x, y : y } );
        }

        for( let k = number; k >= 0; k-- )
        {
            const offsetX = width / number;
            const x = offsetX * k;

            const delta = 2 * ( ( time + k * oscillation * ( duration / number ) ) % duration ) / duration;
            const offsetY = Math.cos( Math.PI * delta );
            const y = offsetY * amplitude + ( height / curves * i ) + thickness;

            points.push( { x : x, y : y } );
        }

        paths.value[ i ] = `M ${points.map( point => `${point.x} ${point.y}`).join( ' ' )}`;
    }
}

onMounted( () => interval = setInterval( () => generate() , rate ) );

onUnmounted( () => clearInterval( interval ) );

</script>

<template>

	<svg preserveAspectRatio="none" viewBox="0 0 100 100">

        <linearGradient id="color-gradient" x1="0" x2="1" y1="0" y2="1">

            <stop v-for=" ( value, key ) in colors " v-bind:key="`color-${value}`" v-bind:offset="`${100 / ( colors.length - 1 ) * key}%`" v-bind:stop-color="value" />

        </linearGradient>

        <path fill="url(#color-gradient)" v-bind:d="`M 0 0 100 0 100 100 0 100 Z`"/>

        <path v-for=" ( path, key ) in paths " v-bind:key="`path-${key}`" fill="#293388" fill-opacity="25%" class="mix-blend-color-burn" v-bind:d="`${path}`"/>

	</svg>

</template>
Glad this helped.


